In order to examine significant predictors of PTS subscales and to test the Hypothesis 2 (Different factors will predict each of the three domains of PTS) of the present study, hierarchical regression analyses were conducted separately for each subscale of PTS. These subscales are intrusion, avoidance, and hyperarousal.
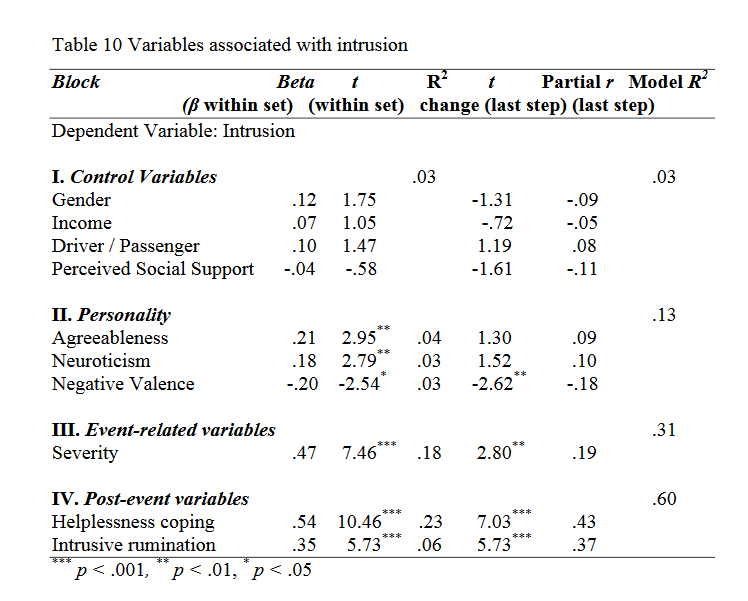
The findings of the hierarchical regression analyses conducted to examine predictors of intrusion subscale revealed that 3% of the variance was explained by the control variables. None of these control variables was significant.
From personality variables, agreeableness (β = .21, t = 2.95, p < .01) positively predicted intrusion, and its inclusion to the regression equation increased the explained variance to 7% (R2 change = .04, F change (1, 219) = 8.71, p < .01). Moreover, neuroticism (β = .18, t = 2.79, p < .01) was positively related to intrusion, and with its entrance into the equation, the explained variance 56 reached 10% (R2 change = .03, F change (1, 218) = 7.76, p < .01). Additionally, negative valence (β = -.20, t = -2.54, p < .05) negatively predicted intrusion subscale, and its inclusion to the equation improved the explained variance to 13% (R2 change = .03, F change (1, 217) = 6.44, p < .05).
When the event related variables were entered into the equation, the explained variance reached 31% (R2 change = .18, F change (1, 216) = 55.70, p < .001). Perceived severity of the event (β = .47, t = 7.46, p < .001) positively predicted intrusion subscale of PTS.
In terms of coping and rumination variables, helplessness coping (β = .54, t = 10.46, p < .001) and intrusive rumination (β = .35, t = 5.73, p < .001) were positively associated with intrusion. The inclusion of helplessness coping to the equation increased the explained variance to 54% (R2 change = .23, F change (1, 215) = 109.39, p < .001). Furthermore, the entrance of intrusive rumination into the regression equation enhanced the explained variance to 60% (R2 change = .06, F change (1, 214) = 32.81, p < .001).
With all the variables in the equation, in the last step, negative valence (t =-2.62, p < .01), perceived severity of the event (t = 2.80, p < .01), helplessness coping (t = 7.03, p < .001), and intrusive rumination (t = 5.73, p < .001) were significant predictors of the intrusion subscale of PTS (See Table 10).
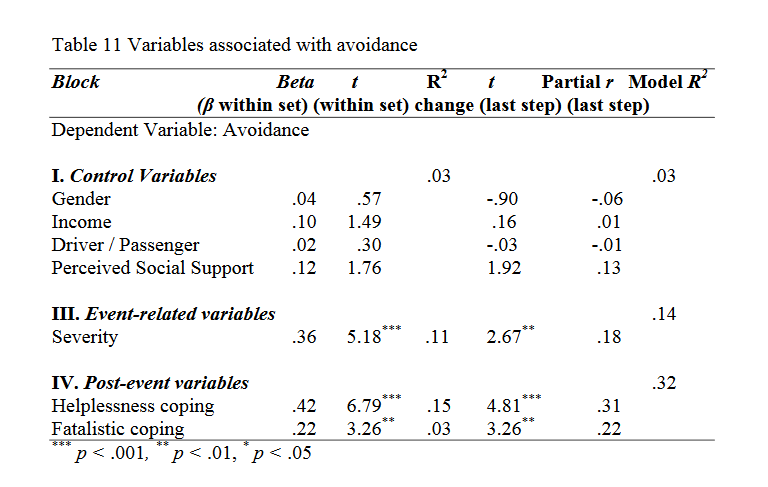
As can be seen from Table 11, according to the results of the regression analysis conducted for avoidance subscale of PTS, control variables explained 3% of the variance.
The addition of personality variables did not increase the explained variance. In other words, none of the personality variables entered into the equation.
The entrance of event related variables increased the explained variance to 14% (R2 change = .11, F change (1, 219) = 26.86, p < .001). Perceived severity of the event (β = .36, t = 5.18, p < .001) positively predicted avoidance subscale of PTS.
Finally from coping and rumination variables helplessness coping positively predicted avoidance (β = .42, t = 6.79, p < .001), and its inclusion to the equation increased the explained variance to 29% (R2 change = .15, F change (1,58 218) = 46.09, p < .001). Furthermore, fatalistic coping (β = .22, t = 3.26, p < .01) was positively related to avoidance subscale, and with its entrance into the regression equation, the explained variance reached 32% (R2 change = .03, F change (1, 217) = 10.65, p < .01).
With all the variables in the equation, in the last step, perceived severity of the event (t = 2.67, p < .01), helplessness coping (t = 4.81, p < .001), and fatalistic coping (t = 3.26, p < .01) were the significant predictors of avoidance subscale of PTS.
As Table 12 demonstrated, the results of the regression analysis conducted for hyperarousal subscale of PTS showed that 4% of the variance was explained by control variables. Being passenger (β = .14, t = 2.01, p < .05) was positively associated with hyperarousal.
From personality variables neuroticism (β = .20, t = 3.01, p < .01) positively predicted hyperarousal, whereas negative valence (β = –.19, t = –2.52, p < .05) was negatively related to hyperarousal. The inclusion of neuroticism to the equation improved the explained variance to 8% (R2 change = .04, F change (1, 219) = 9.05, p < .01), and with the inclusion of negative valence to the equation, the explainedvariance reached 10% (R2 change = .02, F change (1, 218) = 6.34, p < .05).
Furthermore, the event related variables were entered into the equation and the explained variance reached 26% (R2 change = .16, F change (1, 217) = 45.79, p < .001). Only perceived severity of the event (β = .44, t = 6.77, p < .001) positively predicted hyperarousal subscale of PTS.
In terms of coping and rumination variables, helplessness coping ameliorated the explained variance to 49% (R2 change = .23, F change (1, 216) = 97.31, p < .001) and was a significant predictor of hyperarousal (β = .54, t = 9.86, p < .001). Similarly, intrusive rumination (β = .36, t = 5.62, p < .001) positively predicted hyperarousal and its entrance into the equation increased the explained variance to 55% (R2 change = .06, F change (1, 215) = 31.54, p < .001).
With all the variables in the equation, in the last step, being passenger (t =2.06, p < .05), perceived severity of the event (t = 2.03, p < .05), helplessness coping (t = 6.47, p < .001), and intrusive rumination (t = 5.62, p < .001) were significant predictors of hyperarousal subscale of PTS.
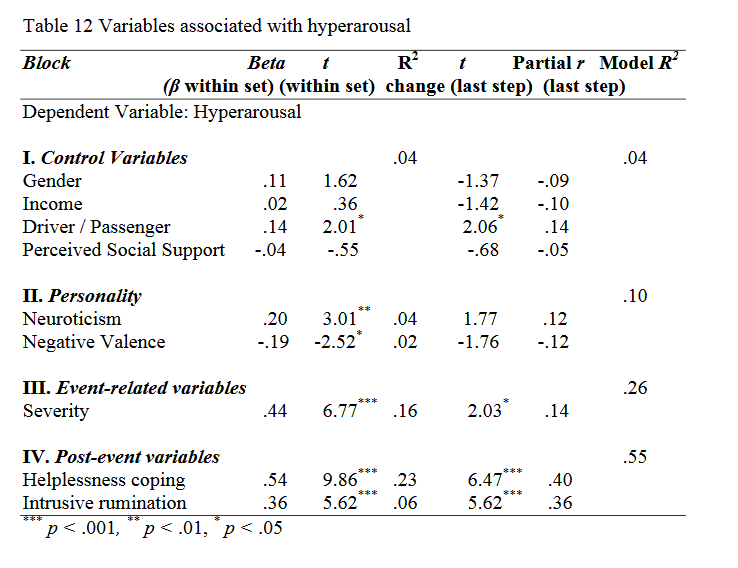
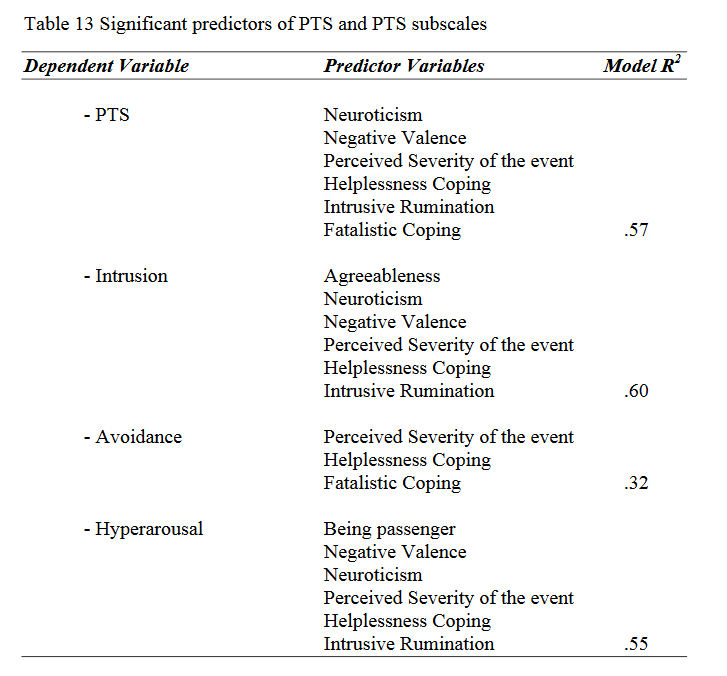
Table 13 summarizes the results of the hierarchical regression analyses performed to examine the predictors of PTS and its subscales.
Recent Comments